Dinosaurs were waaaay more diverse than previously thought
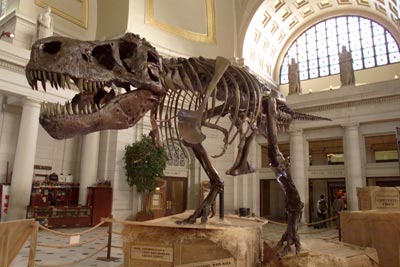
Dinosaurs! What image sprang to your mind then? There’s a reasonable chance, I’d hazard, that your brain just conjured an image of ferocious Tyrannosaurus rex, a nimble and intelligent Velociraptor mongoliensis, or any one of the other meat-eating theropods, notoriously infamous thanks to a certain eccentric millionaire with a passion for splicing genes. These two species of dinosaur are pretty well known to both pop culture and science, and have many fantastic skeletons to represent their iconic names. But not all of our dinosaury friends are so lucky. Theropods (the mostly meat-eating ones, including modern birds) often shed teeth during feeding, or through ‘playing’ with each other or even possible displays of dominance during periods of courtship (much like an average night at most clubs). Either way, it means that many of the fossil remnants from the Mesozoic era we have of extinct theropods are actually just teeth!
There is a size-based bias in the fossil record. If you’re bigger, and have bulkier bones, then your remains most-likely have more chance of withstanding the ravages of time and being preserved. Also, humans are annoyingly bad at only shooting for the largest fossils they find in the field, so often it can be the case that smaller bones are missed. Because of this, theropods, in particular the smaller ones, are often only known from shed tooth remains, of which are usually plentiful throughout the fossil record. One issue with this, however, is that these teeth are often found not associated with any additional skeletal remains, but still have been assigned to old or new species. This kind of thing can be of concern to palaeontologists: if you have a theropod limb bone and some theropod teeth from the same locality, and nothing else, how can you tell if they’re from the same or two different species?
A new study has performed a [geologically] fine-scale analysis of 1183 (a lot) small theropod teeth, taken from sedimentary rocks in western North America and representing an 18 million year time slice until the end of the Mesozoic era (the end-Cretaceous, about 65.5 million years ago). The aim was to see if was possible to rigorously test the shapes of these teeth using quantitative methods to see if they fall in to separate and diagnosable ‘morphotypes’ may that represent different species. Currently, only four small theropod species are known from this time and place from more complete skeletal material: Dromaeosaurus albertensis, Richardoestesia gilmorei, Saurornitholestes langstoni, and Troodon formosus. This is actually pretty cool in theory, as if you can develop a more rigorous method of assessing biodiversity through time in the fossil record that accounts for what we know is present from less-complete remains, and then it helps us to make better judgements in the absence of decent non-toothy fossils. In turn, if we have a method to improve models of past biodiversity, then we can use this to help refine our models of forecasting future biodiversity dynamics in extant species.
So what did they do?
Of the 1183 teeth, they used previously published and newly gathered data to create a database of 5 measurements of particular aspects of the geometry of these teeth (e.g., the basal width; the width of the bottom bit). Of these, 8 morphotypes were identified before any analyses as representing possible individual species, and assigned to 10 different lithostratigraphical, or rock- and time-based, units, which gave a total of 34 different ‘types’ (some units had none of these particular types present). These morphological and lithostratigraphical (we love our big words don’t we…) samples were reduced to account for samples that were too small, or didn’t have the morphology to make proper measurements, so that all comparisons made were more equal. This left 1047 directly comparable specimens in 32 categories, a pretty hefty sample size!

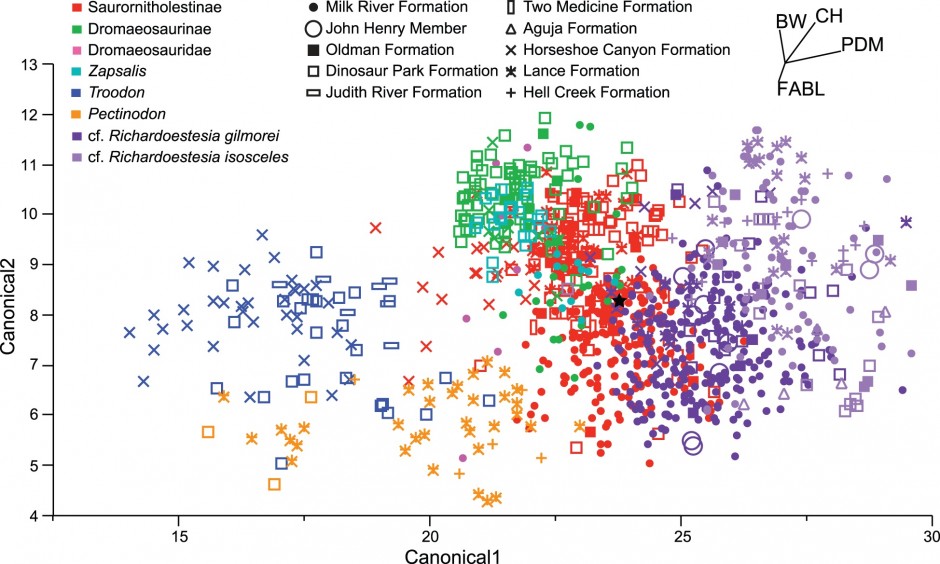
These categories can be combined with their relevant tooth measurement data, and passed through some statistical tests to see how the groups are related. The authors decided to use two, which have the lovely names of canonical variates analysis (CVA), and discriminant function analysis (DFA). The mathematics behind these is pretty nasty, but how they work is actually pretty neat. For CVA, imagine each specimen representing a point, and all of the specimens in one particular category forming a cluster or cloud of points, but in statistical space. There are 32 categories though, and you have to sort of squish them all into the same statistical area, based on the raw tooth measurements. In the end, you’ll get something that has 5 dimensions (don’t try and picture it), and sort of represent the sky on a cool summers day, with all the cumulus hovering above. Each one of these clouds has a centre, or ‘centroid’, representing their multivariate (multi-variable, there are 5 dimensions) centres in mathematical cyberspace. What CVA does, is tries to pull these group centroids apart, by maximising the distance between them by stretching, squeezing and mathematically distorting all of the clouds relative to each other. What you end up with is a number of axes minus one that inflict the greatest dispersion on these clouds (there are 32 groups, so you need 31 axes to split them). As these groups are distorted the distances between each point and the centroid changes. What you can then do, is see how accurate your assignment of the underlying categories was, by looking at the distances of the points relative to all the group centroids; as in, if a point is closer to another group’s centroid, then it has been incorrectly assigned. What this gives you is a statistical deduction of whether or not the assignments you have made based on the category definitions and input data are actually valid. You can represent this as success percentages for each category. I’ve never used DFA, but think it operates in largely the same way but only using two categories per analysis, and re-running and comparing it between different group combinations.
What these both give you an idea of is how distinct the different groups are (i.e., low success percentages means that there was too much similarity or overlap between the groups), and whether they can represent quantitative morphotypes. Pretty sweet eh. The difficult part though, is deciding what threshold of success do you consider to be good enough to represent a distinct morphotype? When doing statistical analysis, you usually have to get around a 95% ‘success rate’ (or a probability-value of less than 0.05) for results to be ‘statistically significant’. The authors have decided here that a 75% success rate warrants further examination; with no justification for this seemingly arbitrary threshold (one suspects it was to inflate the number of ‘positive’ results).
What did they find?
The CVA results overall only gave a 38.2 per cent correct assignment rate, which is quite low. This probably reflects the large sample size, and an overlap between groups that doesn’t reflect taxonomy or distinct species, but instead convergence on many different tooth geometries, that could betray numerous subtly distinct feeding styles. The DFA analyses, however, showed that the different morphotypes are distinct when filtered through the different locations (geological formations). However, for categories that represent coeval deposits (those formed at the same time) there is little distinction between representative morphotypes. For species where teeth are known, so a more accurate relation of local shed teeth can be drawn, hit ratios were generally substantially higher on average, illustrating the value of more complete skeletal material with associated teeth.
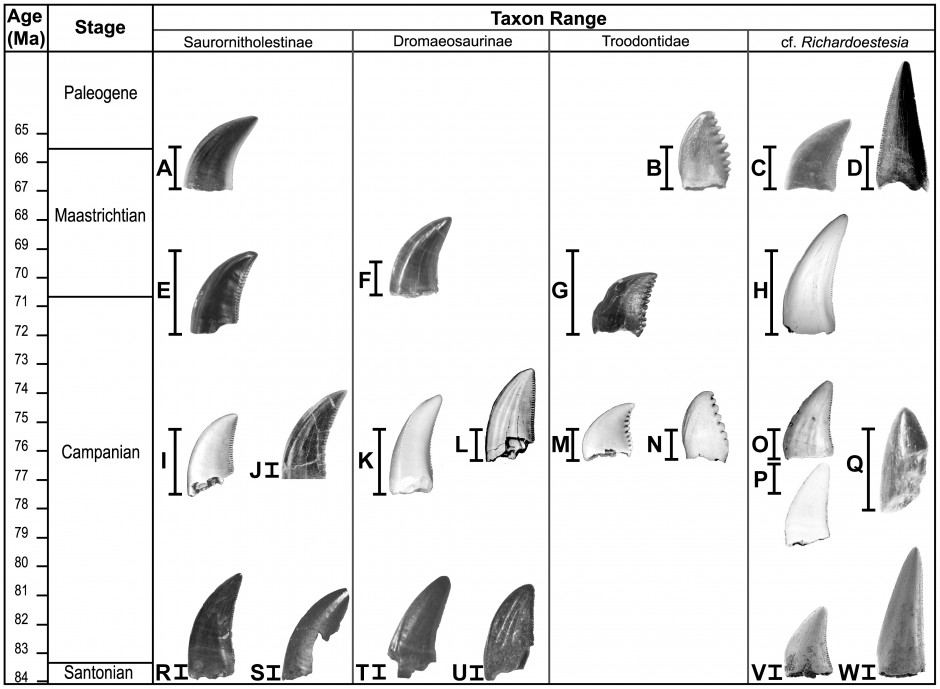
The total number of distinguishable morphotypes, representing different species in space and time and based on the initial categories was 23, substantially higher than the previously identified four species. This also excludes birds. Through time, this shows a pattern of high diversity during the Campanian period (about 83-71 million years ago), and then reduced diversity from then on until the end-Cretaceous mass extinction, a pattern that has been suggested for many other groups of dinosaur. What this demonstrates, is that our knowledge of current dinosaur diversity patterns may be seriously deflated in groups not well-represented by big bones and lots of skeletal material, and that there is a substantial ‘hidden’ diversity waiting to be uncovered from the toothy remains in many groups. Unfortunately, the authors do not deem it appropriate to assign new names to the other 19 newly identified species, until other associated remains are found. They’re current status will just have to be Theropoda indet., in taxonomy speak (indeterminable theropod!). Another thing this study warrants is caution in assigning new material to known species with a large time or space gap, as it is probable that when assessed quantitatively, superficial similarities will be less use in species assignments.
Finally, I have a few questions that it’s worth pondering over. The study has been published in PLOS ONE, so is freely available for anyone to read should they wish.
- Should we assign species names to remains that are distinct, but only known from teeth remains?
- What if different teeth represent different feeding styles within allopatric (different geographical areas) members of the same species?
- Do individuals have several different tooth morphotypes, or is all variation representative of between-species differences?
Reference:
Please forgive – I am weird:
1)
Should we assign species names to remains that are distinct, but only known from teeth remains? Yes, something to sink your teeth into.
2)
What if different teeth represent different feeding styles within allopatric (different geographical areas) members of the same species? That would bite.
3)
Do individuals have several different tooth morphotypes, or is all variation representative of between-species differences? That argument is growing a little long in the tooth.
Had to, sorry, wait too serious! Good post, though,
Scott
A slightly more serious response to question (2) “What if different teeth represent different feeding styles within allopatric (different geographical areas) members of the same species?”
Before you get to differing tooth shapes from allopatric feeding style variation, wouldn’t you go through differing tooth wear patterns first?
Goodness, good question. Both will vary according to diet. Wear is a function of the hardness of the substrate (ie prey). Overall geometry is supposed to reflect trophic style to some degree, although this hasn’t ever been rigorously quantified, as far as I’m aware..
Hmmmm, I see your general point, but … describing the siliceous phytoliths (spelling?) in grasses as “prey” is stretching English a bit. Before the grasses came along (a post-Cretaceous development) there may have been other relatively hard-wearing plant tissues. Anyone know? The hadrosaurs had some reason to make those impressive tooth-batteries, after all.
But let’s think as bit more about it. If you’ve got a population of teeth from a particular context (litho- and hopefully chrono- stratigraphic), then you might find generalised tooth-to-tooth wear on one facet of the tooth, while tooth-to-food wear would probably be more evenly on both facets. Which I was thinking might give you an orientation of the teeth in the jaw ; but on second thoughts if you get tooth-tooth wear on the lingual facets in one jaw segment [mandible, dentary], then the corresponding teeth in the [dentary, mandible] would have wear on the buccal facets.
So that’s not going to help so much with grouping teeth into possible sets.
Without quantification of serial variance in teeth, which exists in several of the taxa identified in this study, tooth samples cannot always be adequately placed. A good example of this would actually be shark teeth, in which serial variation of uppers and lowers is well-documented in fossil samples only when arrays of teeth, preserved from single individuals, are found. Theropod teeth, however, are commonly considered to be found due to incidental shedding, and thus finding them in series rare, and thus positional variation difficult to affirm. I think this issue should be resolved before designating any further tooth-based taxon. I tend to treat them as parataxonomic entities for now.
magnificent submit, very informative. I wonder why the opposite specialists of this sector do not understand this. You must proceed your writing. I’m confident, you have a great readers’ base already!