To bird or not to bird..
This was originally posted at: http://blogs.egu.eu/palaeoblog/?p=963
In 2012, the controversial case over whether or not Archaeopteryx lithographica, perhaps the most iconic dinosaur species of all time, was a bird was settled. Apparently. (free pdf) This was an important analysis for two reasons. Firstly, it countered a previous study showing that Archaeopteryx was more closely related to dinosaurs like Velociraptor and Deinonychus, and secondly used advanced, sort of non-traditional methods in palaeontology, called maximum likelihood and Bayesian analysis, to work out its relationships.
None of this is news. It was extensively covered upon release way back, and also revisited recently with the discovery of Aurornis xui, which was found to be the most basal bird (i.e., that which was closest to the origin of the group, typically known as Avialae, or Aves).
Now a new-ish study, from the December issue of a journal called Cladistics, has re-examined the data from the 2012 study, asking the question of whether or not the analyses they used even made sense to do in the first place. This is actually quite important. Maximum Likelihood and Bayesian analysis where designed with models in mind for describing the evolution of nucleotide data, that is genetic sequence data. Whether or not they can actually be used in fossil data, or that which is based purely on anatomy, is questionable, as anatomical features, or characters, evolve in a different manner to genetic data (e.g., there aren’t any transversions or transitions). Given how often now these methods are used for genetic data, and to great effect, it’s a bit weird that it seems to have been largely overlooked by palaeontologists and scientists who use morphology to reconstruct evolutionary relationships.
Usually, palaeontologists use a method called parsimony analysis, which is a much simpler model for generating evolutionary trees. To use any of the programs below, download one of the nexus files from here (dinosaurs!), and run it with the program – worth a fiddle for a bit of science-ing!
Parsimony
Sometimes called maximum parsimony, it’s a method of determining a tree that is the simplest to construct based on the data. Each change in morphology counts as a ‘step’, so you use various swapping algorithms to find the branch and species arrangement with the fewest steps. This is sort of like the path of least evolutionary resistance. Programs that do this include TNT.
Maximum Likelihood
Likelihood methods calculate the tree that maximises the probability of the observed data. It does this by determining the probability that a proposed model of evolution, combined with the hypothesised relationships, would give rise to the data set which you input (i.e., the character matrix – see previous blog post). A tree with the highest probability is that which is preferred, as its more likely to represent the input data. It’s not about whether or not a hypothesis is “likely” to be true, as often misconstrued. Phylip is a decent program for running this kinda analysis.
Bayesian inference
Bayesian analysis is sort of similar to ML in that it involves probabilities. It relies on Bayes theorem, which generates what’s called a posterior probability (the probability of a hypothesis being true given the data) based on an estimate of the prior probability (probability of the hypothesis being true before new data) and the likelihood of the hypothesis given the data. So it’s an extension of ML in that it incorporates existing knowledge into the calculations. Good software for running Bayesian analysis includes BEAST or MrBayes
So whut?
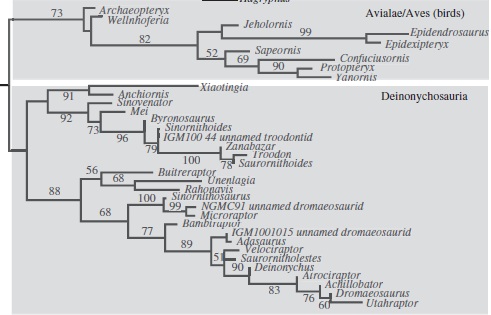
So swinging all this intel back to Archaeopteryx and this new study, what does it all mean? Well, the authors re-generated the previous analyses using parsimony and ML analyses. They actually found a lot of conflict, such as the dissolution of the group Tyrannosauroidea (a usually pretty solid group, which includes Tyrannosaurus) using ML, and in the parsimony analysis, Archaeopteryx was no where near the base of Avialae, instead in a different group called Archaeopterygidae. In the ML analysis though, Archaeopteryx is the most basal avialan, with no sign of an Archaeopterygidae group. However, when a method of weighting that gives more ‘signal strength’ to stronger characters is used on the parsimony results, Archaeopteryx switches again to being the most basal avialan.
So it’s all a bit confusing, and the devil is most certainly in the details in this case. For the ML and weighted analyses, a different set of characters ends up defining the group Avialae, and hence why Archaeopteryx is included within. But for all three analyses, there are a different set of unambiguous features that define the clade, and hence this is why the placement of Archaeopteryx is uncertain: because of the ways in which different analyses treat characters. For example, one feature, or character “length of pedal phalanx II-2 is greater than or equal to the length of pedal phalanx II-1 [so the relative lengths of the first and second foot bones on the second digit] is present in both Archaeopteryx and basal deinonychosaurs, which would group them together to a degree.

This also occurs with many of the other characters that are important in defining the base of birds (Avialae) – some are scored differently for different deinonychosaurs and avialans, which makes species which share an unusual combination of them, such as Archaeopteryx, difficult to place.
So while the ML and Bayesian results from the original study recover what can only be described as a ‘preferential’ position (well, it made a splash in the news), it also recovered some other weird results such as the breakdown of tyrannosauroid relationships. This is pretty at odds with many recent analyses of theropod dinosaurs. So, really, at the end of the day, this position of Archaeopteryx should be treated with *extreme caution* until the evolutionary implications of the anatomical transitions is explored in more depth. This will probably mean more species need to be analysed from a broader range alongside Archaeopteryx, to determine the real sequences of morphological change. It also shows that just because you get a result that you like, doesn’t mean it’s the correct one.
Future research really has to explore how the methods mentioned here can be applied to fossil morphological data. At the moment, it seems like perhaps we have unstable results, unsurprisingly, given that the methods used were never designed to handle fossil data.
As always, nothing is set in stone.
References
Spencer, M. R. and Wilberg, E. W. (2013) Efficacy or convenience? Model-based approaches to phylogeny estimation using morphological data, Cladistics, 29(6), 663-671 (link)
Lee, M. S. Y. and Worthy, T. H. (2012) Likelihood reinstates Archaeopteryx as a primitive bird, Biology Letters, 8(2), 299-303
Interesting post. Please check out my Archaeopteryx drawing on my blog.